Let's check it out !
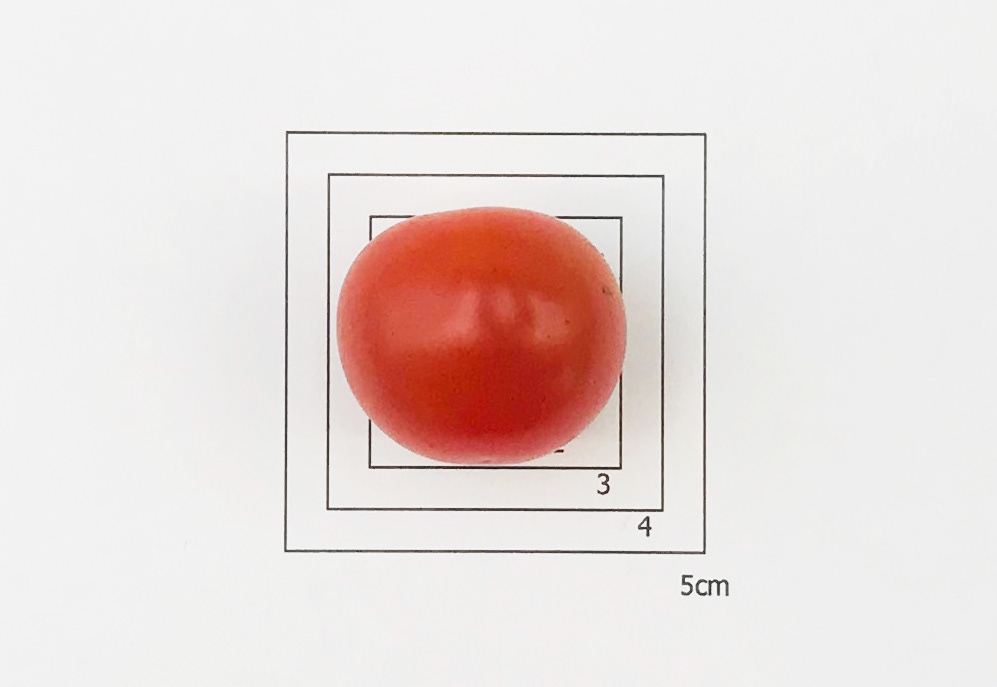
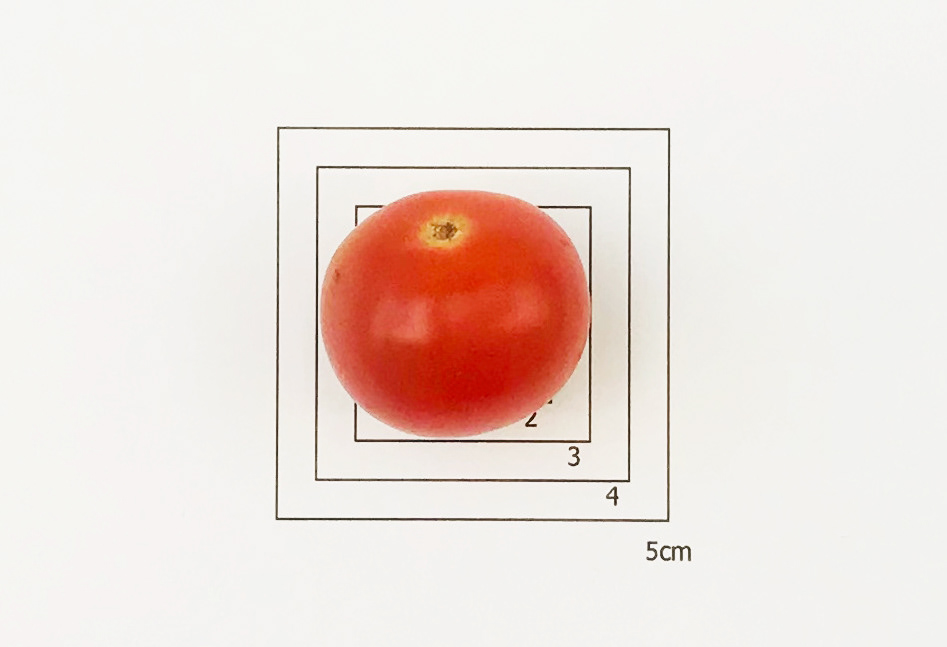
Four perspectives on today's No.2 cherry tomato


From. No.2 tomato is comes from one of the best tomato country in America.


Growth process. No.2 tomato fruit development and tissue morphology in WT Micro-Tom cultivar. (A) Whole fruit and equatorial fruit sections from anthesis to red-ripe stage. The axes of growth: proximal to distal, medio-lateral and abaxial to adaxial are reported. (B) Equatorial ovary section and ovary wall section at anthesis stained with calcofluor. (C) Equatorial fruit section and pericarp section at breaker stage stained with calcofluor. DPA, Day Post Anthesis; OW, ovary wall; Pl, placenta; Ov, ovule; OE, outer epidermis; IE, inner epidermis, VB, vascular bundle; C, columella; LT, locular tissue; S, seed; RP, radial pericarp; P, pericarp; En, endocarp; Me, mesocarp; Ex, exocarp.
The top window shows the buttons for several available tools (i.e, open image, save fruit, export data, fit size, analyze and revise). The object in the upper-right window has been selected for manual adjustments and the data are displayed in the lower-right window. The values for this fruit are highlighted in gray in the lower right data window. The objects outlined in yellow in the left window will be included in the analyses whereas objects outlined in blue will not be included in the analyses.
Chromatographic. Standard color checker for Color Test module to calibrate the color values obtained from different scanners and at different times. No.2 has a relatively complete chromatography
Linear shape. An image used for the Tomato Analyzer - Color Test application. Shows No.2 in a relatively perfect shape
Cell expansion. | Pericarp cell expansion in fruit weight and tissue morphology mutants. (A) Fruit pericarp section stained with toluidine blue for P40D11 (cluster 1) and P12G7 (cluster 2) mutants. In P12G7 mutant, the outgrowth of the pericarp toward the locular cavity of the fruit, forming lobes, is clearly visible as well as the elongated shape of the largest cells. Pericarp cell dimensions along the medio-longitudinal (X) and adaxial-abaxial (Y ) axis used to measure cell shape are indicated. En, endocarp; Me, mesocarp; Ex, exocarp. (B) Cell axial ratio (X/Y ) of the 10 and 25% largest cells inside the pericarp for FWEc mutants of cluster 1 and PEL mutants of cluster 2. Asterisks represent significant difference (t-test, P-value < 0.01) between the mutant and the WT. A representation of cell shape is given for each mutant based on the ratio values obtained for the 10 largest cells.
Correlation network analysis. This analysis of the fruit weight and tissue morphology mutants and of phenotypic traits measured in the tomato mutants. Only significant positive (solid lines) or negative (dashed lines) Spearman rank correlations with (A) FDR adjusted P-value < 0.01 or (B,C) P-value < 0.01 are considered in the networks. (A) Mutant correlation network based on 24 fruit traits. Mutants whose fruit characteristics have similar trends are clustered together. (B,C) Trait correlation networks are represented based on 29 fruit and ovary traits separately for mutant (B) cluster 1 and (C) cluster 2. A color code is used to distinguish the different subcategories of the phenotypic traits: ovary (yellow), fruit weight (purple), ploidy (blue), cell area (gray), fruit tissue (orange). The size of each node is proportional to the number of correlations with other traits. Phenotypic traits without significant correlations are not reported in the Figure.
*All the research results come from professional tests in our honest tomato laboratory.*